

YOUR CART IS CURRENTLY EMPTY
How can I measure the success of my exhibition participation?
Measure it in two stages. Report leads, meetings and cost per lead straight after the show, and report trade show ROI as the deals close. ROI is the gross profit from deals you can trace to the show, minus the full cost of the show, divided by that cost and shown as a percentage.
To get a number you can defend, you need three things: every cost counted, every lead tagged with the show in your CRM, and a reporting window long enough for your sales cycle. These are the questions that come up when you report on a show.
How do I calculate trade show ROI?
ROI (%) = (gross profit from show-sourced deals - total cost of the show) ÷ total cost of the show × 100
This is the standard financial ROI equation: net benefits divided by costs. Two choices make it credible to a finance team:
- Use gross profit, not revenue. A $100,000 sale with a 30% margin returns $30,000 to the business, and that is the figure to set against the show's cost.
- Use the full cost. Leaving out travel or staff time makes the ROI look better than it is, and finance will ask.
Should I judge a show on ROI alone?
No. If the show's job was to launch a product or look after key accounts, measure it against those objectives too. See ROI vs ROO for how to set objectives you can count and report both measures.
What costs should I include?
Cost is where an ROI figure is easiest to understate. Use one list for every show so the numbers compare year on year:
- Floor space: space rental, plus any sponsorship or listing fees.
- Stand: design, build or hire, graphics and furniture.
- Venue services: power, rigging, lighting, cleaning, internet and any extra furniture you order.
- Freight and storage: delivery, empty-case storage, return freight, storage between shows.
- Installation and pack-down: labour, or your own team's time to do it.
- Travel: flights, accommodation, meals and local transport.
- Staff time: days on the stand and in preparation, at a loaded day rate (salary plus on-costs such as super and payroll tax).
- Promotion: pre-show campaigns, giveaways, hospitality, sampling.
- Lead capture: scanner or app hire, and any data or CRM setup.
- Follow-up: post-show campaign and sales time spent on show leads.
For the first two lines, our page on what an exhibition stand costs sets out published floor space rates from Australian shows and our own stand prices.
How do I work out cost per lead?
Cost per lead is the measure you can report the week after the show, long before deals close:
Cost per lead = total cost of the show ÷ number of leads
Work it out for qualified leads and meetings too, because a pile of badge scans is cheap per unit and tells you little.
What does that look like for a real show budget?
Take a show that costs $45,000 all in:
| Measure | Result | Cost per result |
|---|---|---|
| Leads captured | 150 | $300 |
| Qualified leads (fit your criteria) | 60 | $750 |
| Meetings or demos booked | 18 | $2,500 |
| Deals closed within 12 months | 3 | $15,000 |
Suppose those three deals earn $75,000 of gross profit. Subtract the $45,000 cost to get $30,000, then divide by the cost: $30,000 ÷ $45,000 × 100 = about 67% ROI.
These figures are only an illustration. Your industry, the show and your deal size shape the numbers, so use your own history as the benchmark rather than a published average. Track the same measures at every show and compare like with like.
How do I track show leads and revenue in my CRM?
ROI depends on being able to trace a deal back to the show. Set this up before the show, not after:
- Create one CRM campaign per show, named with the show and year.
- Tag every lead on upload. Add the campaign, the grade the stand team gave it and the next step offered.
- Separate new contacts from existing customers. Report sourced pipeline (new leads from the show) apart from influenced pipeline (existing opportunities that met you at the show).
- Make sales log the source. Opportunities created from show leads keep the campaign, so the deal is credited when it closes.
- Set the attribution window. Decide upfront how long a deal can take and still count, and match it to your sales cycle. A product with a three-month cycle and one with an eighteen-month cycle need different windows.
What's a common way to lose a show's ROI?
Slow follow-up. Our 48-hour follow-up plan covers owners, templates and CRM fields.
How do I measure success beyond ROI?
Not every return shows up as revenue in the first year. These measures show whether the show did its job:
- Stand traffic: visitor counts or scans per hour, by time of day.
- Engagement: demos completed, average conversation length, touchscreen or app analytics.
- Lead quality: share of leads that meet the criteria agreed with sales.
- Existing customers: customers met on the stand, and their retention afterwards.
- Partners: distributor, partner or supplier conversations that led to a next step.
- Brand reach: social media mentions, use of the show hashtag, press coverage.
- Visitor feedback: short surveys or comments from people who visited the stand.
- Competitor activity: notes on what other exhibitors showed and how busy their stands were.
- Team feedback: a debrief with the stand team on what worked and what didn't.
- Trend: the same measures compared with your previous shows.
Does my stand design affect the results?
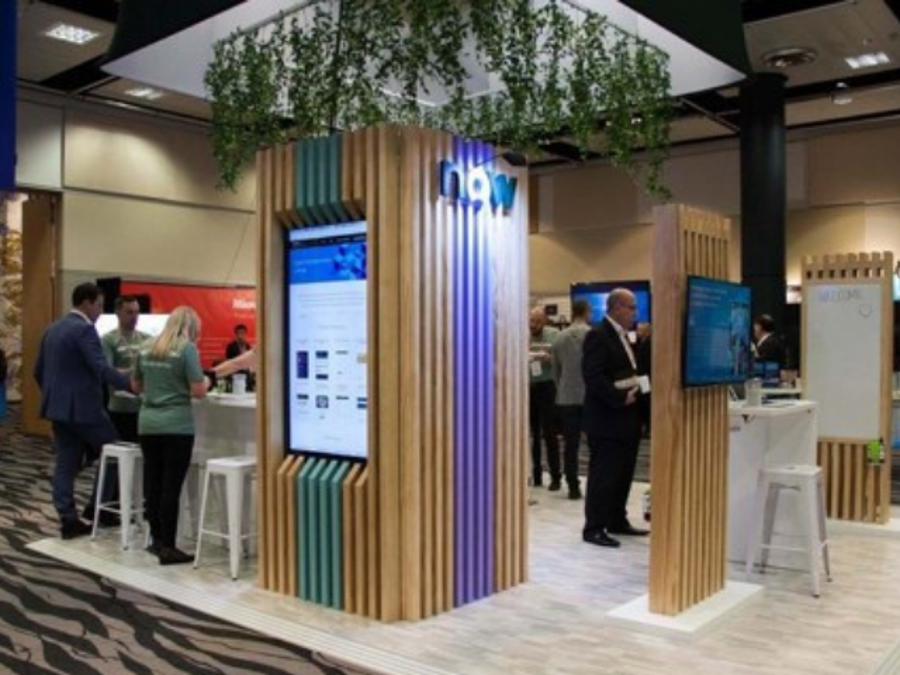
Yes, it affects several of these measures. Meetings need somewhere to sit, demos need screens at the right height, and lead capture needs a clear point near the aisle.
How should I report the results to leadership?
Leadership wants one page they can compare from show to show. Use the same layout every time:
| Line | Target | At close of show | At 90 days | At 12 months |
|---|---|---|---|---|
| Total cost | ||||
| Leads / qualified leads | ||||
| Cost per qualified lead | ||||
| Meetings or demos | ||||
| Pipeline sourced / influenced | ||||
| Deals won and gross profit | ||||
| ROI (%) | ||||
| Non-sales returns | ||||
| Changes for next time |
Set the targets before the show and fill in the close-of-show column within a week of it. Then add pipeline, deals and ROI at each review date. Keep last year's report alongside, so trends are obvious. For the wider case for exhibiting, see why face-to-face events still win B2B deals.
If you want a stand built around the numbers you need to report, from a meeting area to a lead capture point near the aisle, talk to us about custom exhibition stands or call 1300 240 250.